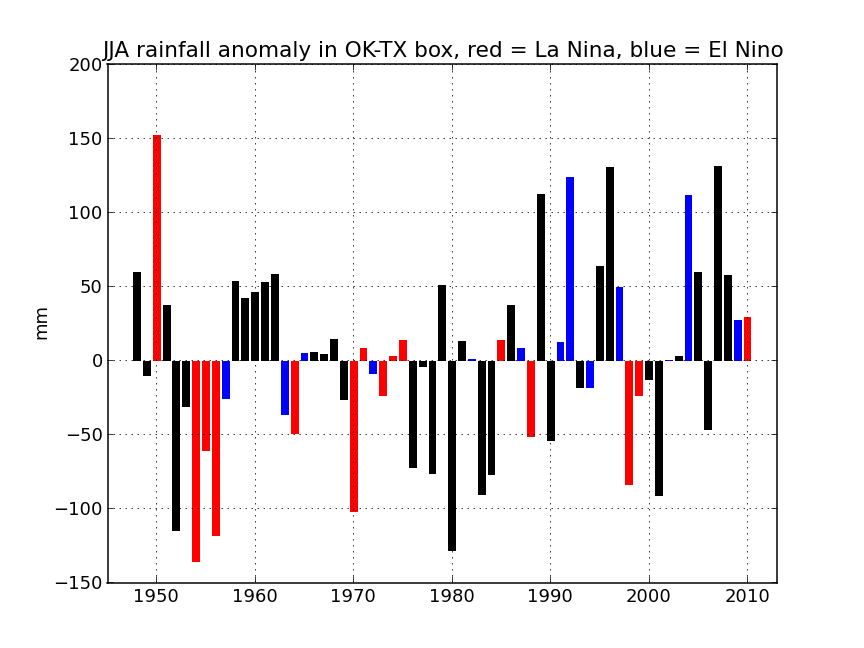
JJA summer rainfall anomalies in US, 1948-2010
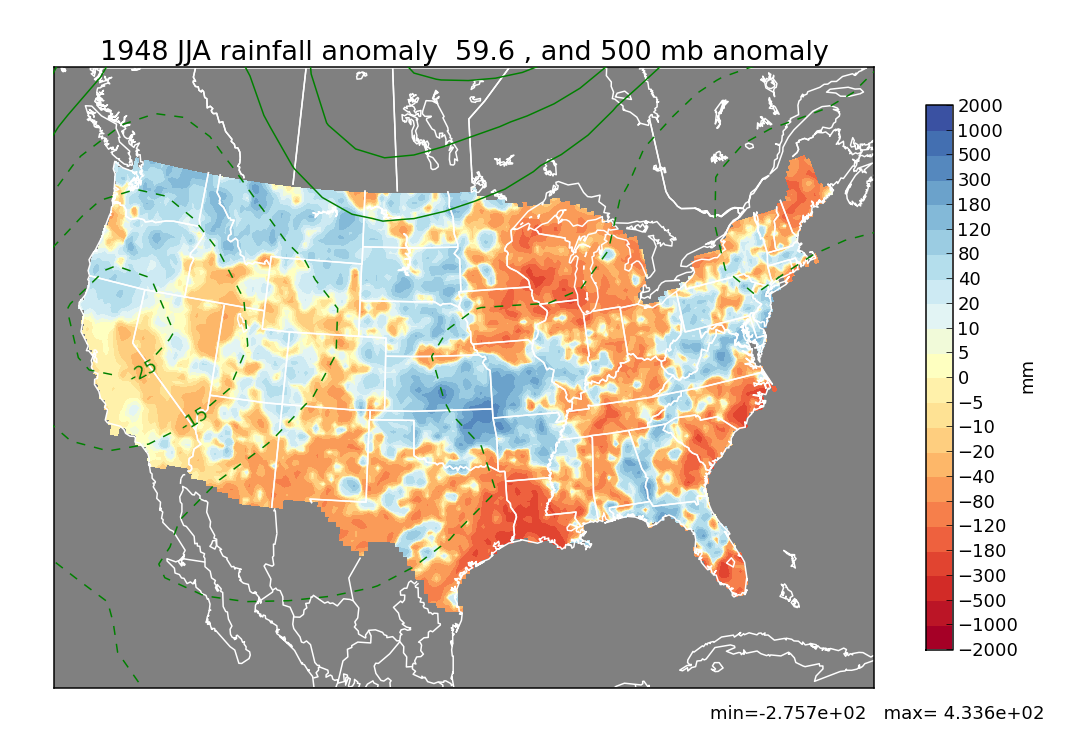
JJA Rainfall departure from average, from CPC. Red text implies La Nina summer. Blue text implies El Nino summer.Green contour is JJA 500 mb anomaly, from ESRL.
The number in the title is the average rainfall anomaly in a box containing Oklahoma and northern Texas.
See NCEP site for El Nino and La Nina years. See also my JJA SST Anomaly (ESRL) , 1948-2011 and my thoughts.
|
Note that except for 1950, if you knew in May that JJA would be a La Nina summer, you might be inspired to confidently predict drought in the OK-TX box. In fact, 1950 JJA was the least intense La Nina of the 15 JJA designated as La Nina by NCEP.