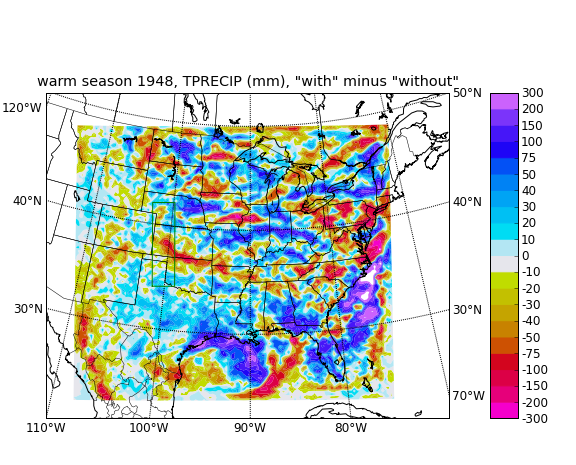
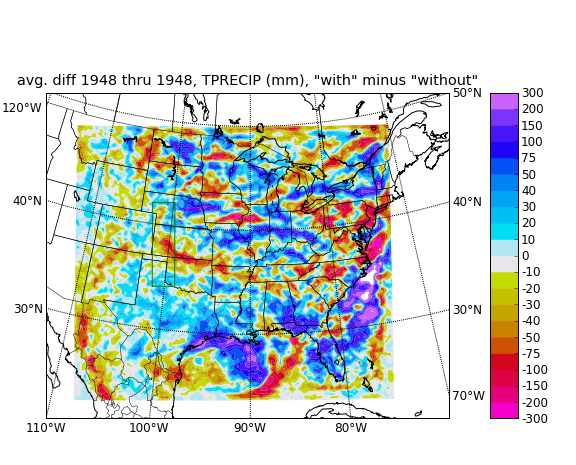
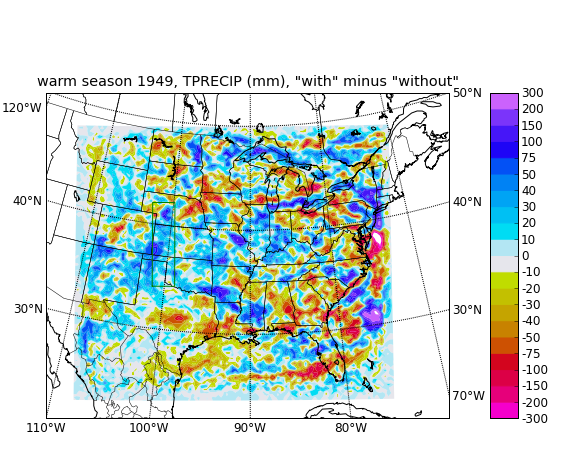
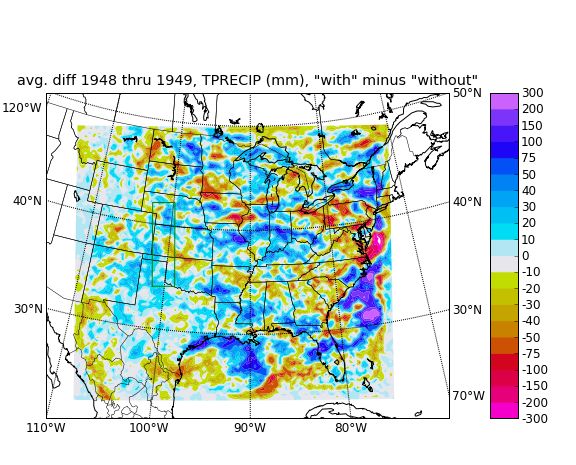
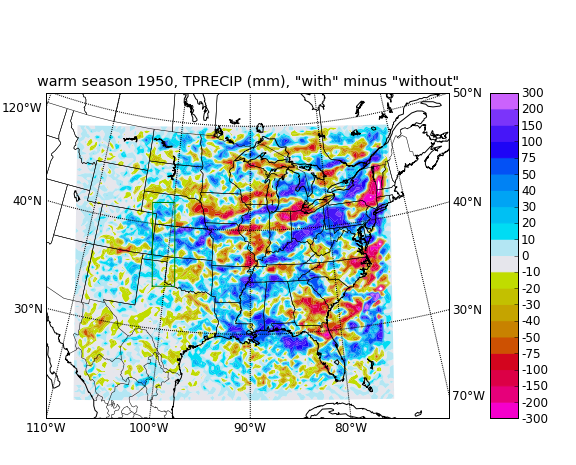
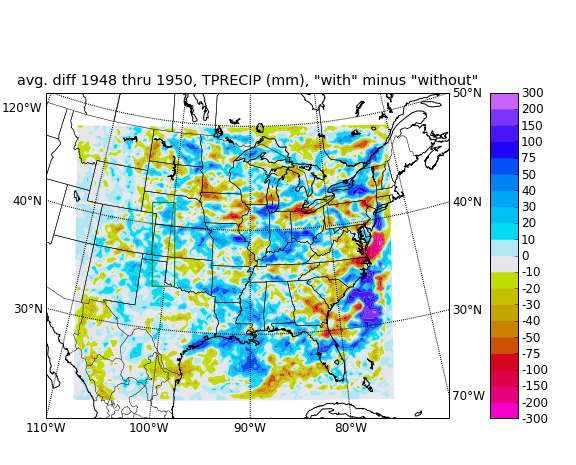
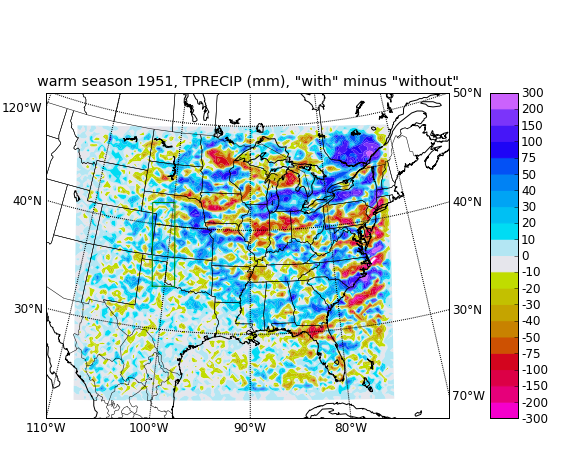
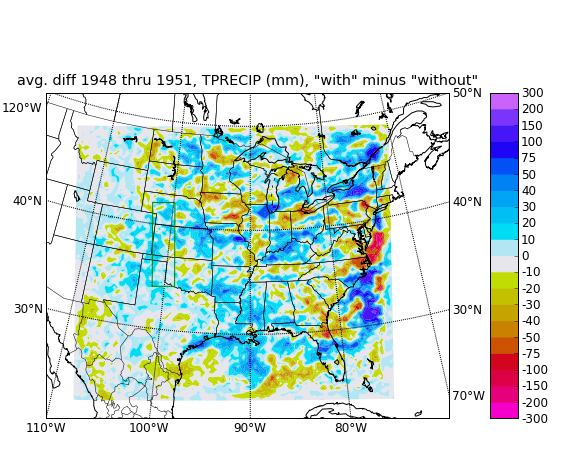
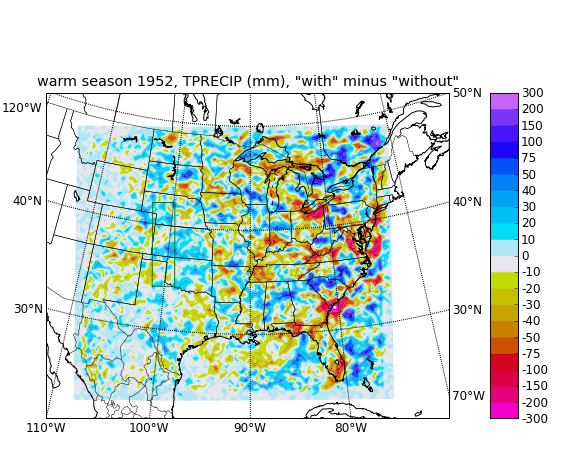
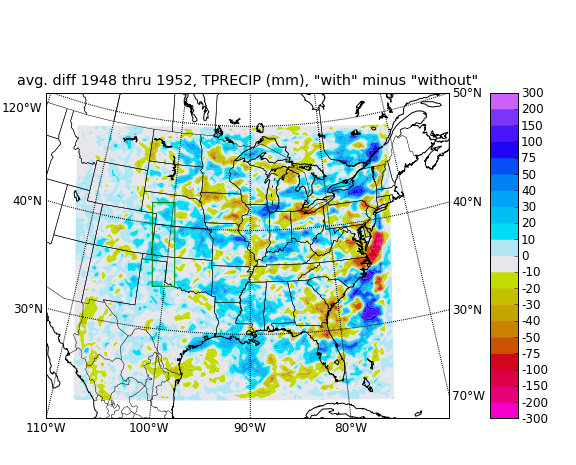
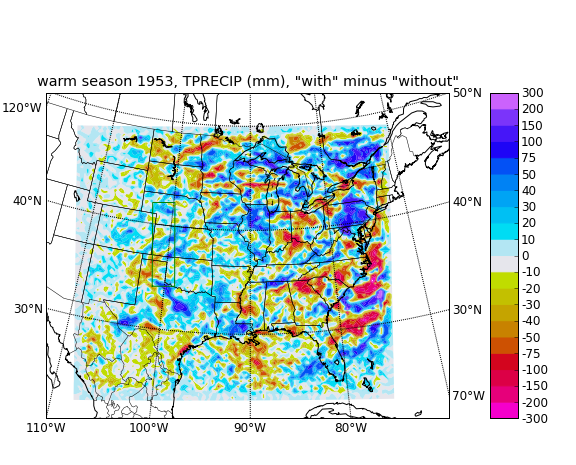
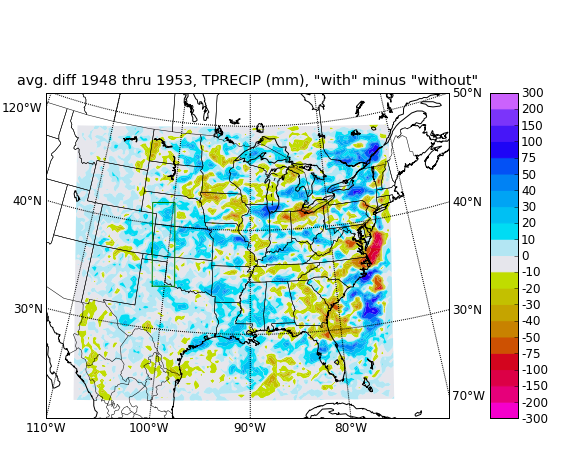
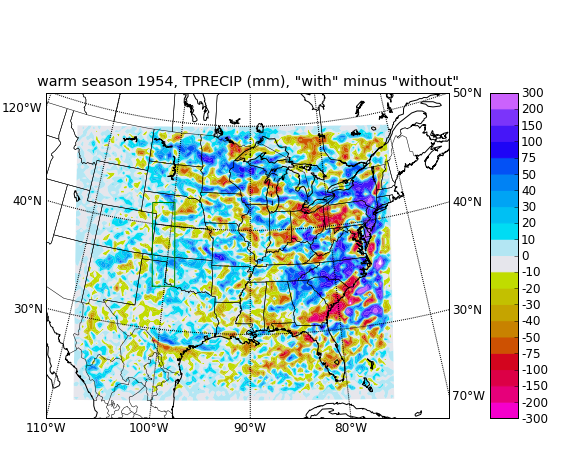
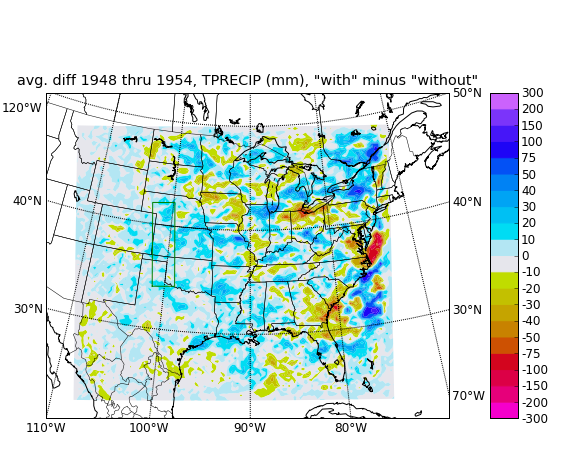
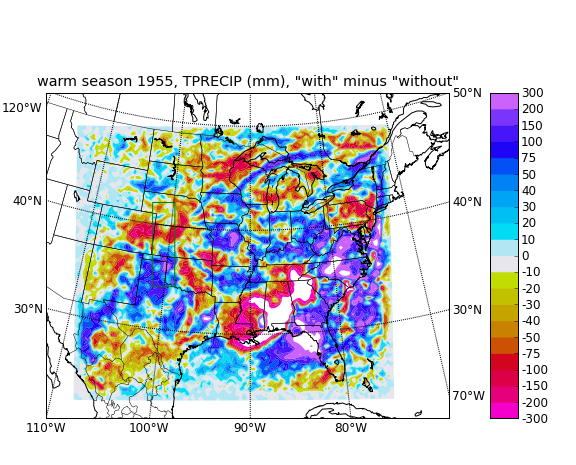
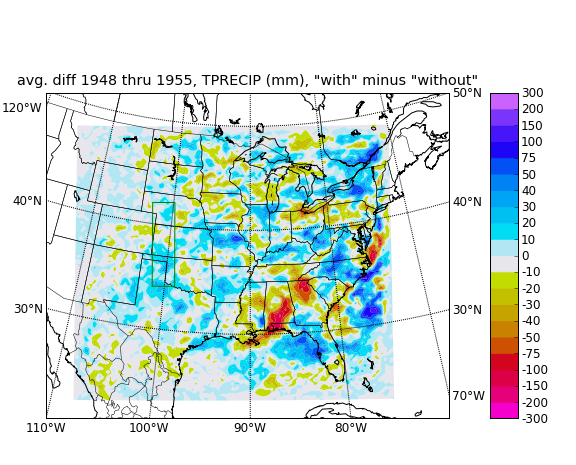
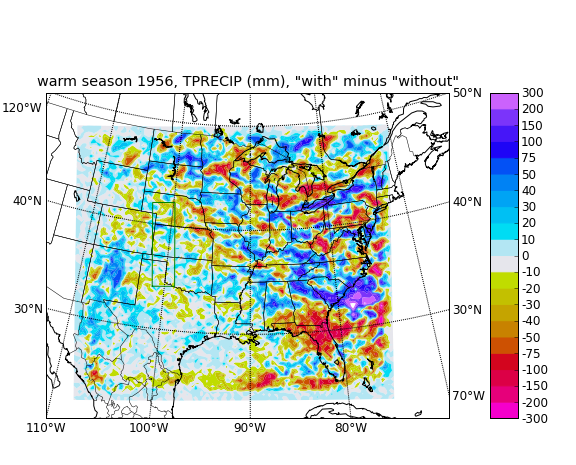
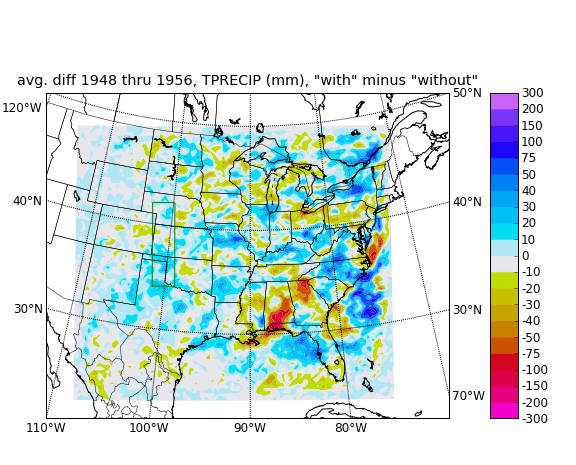
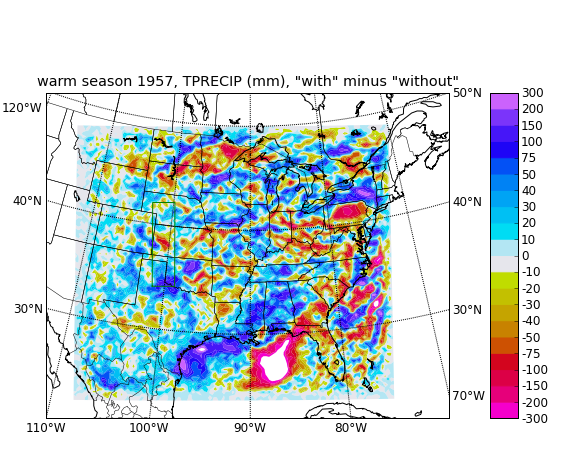
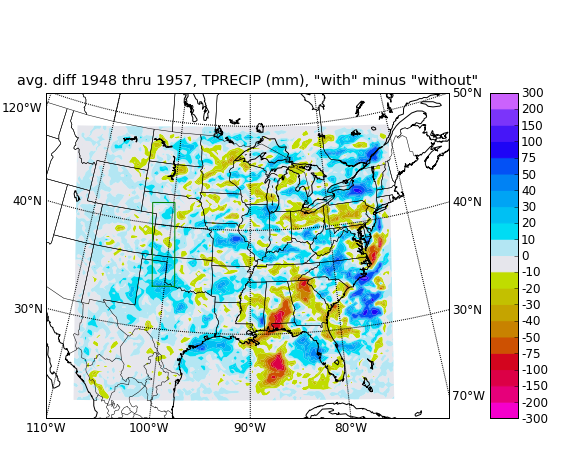
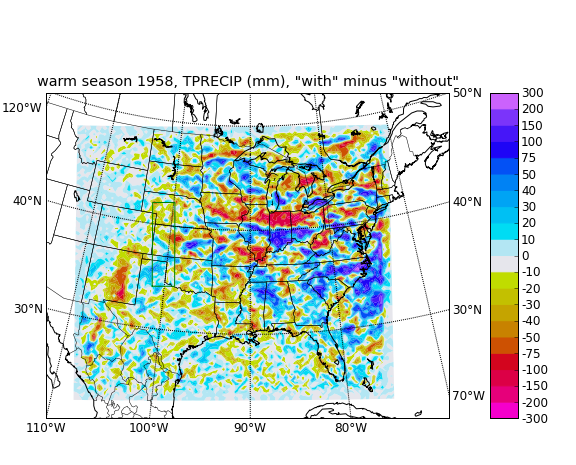
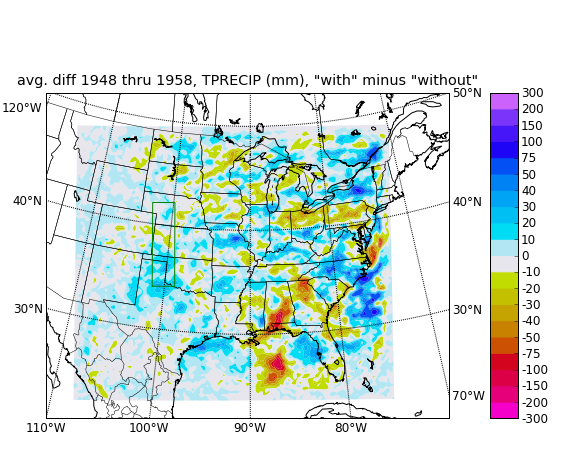
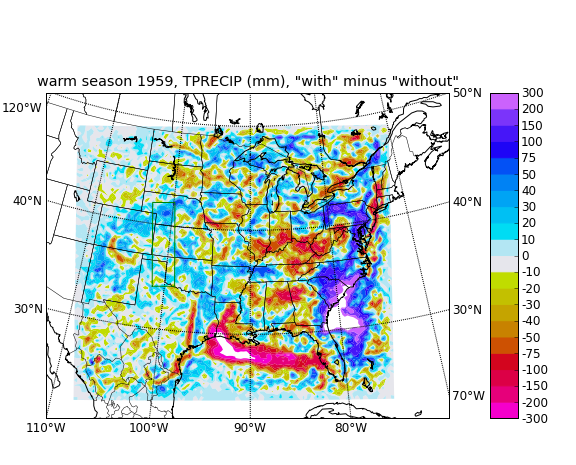
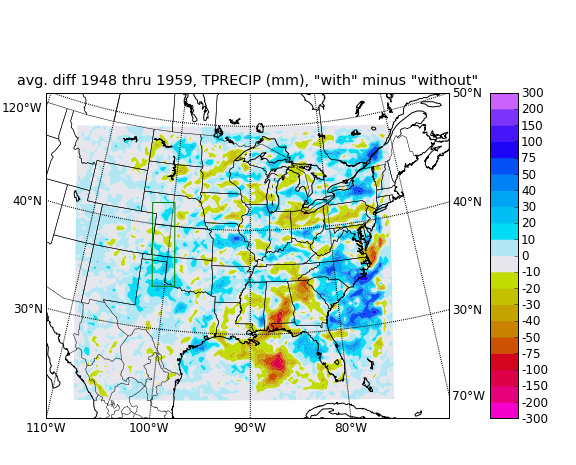
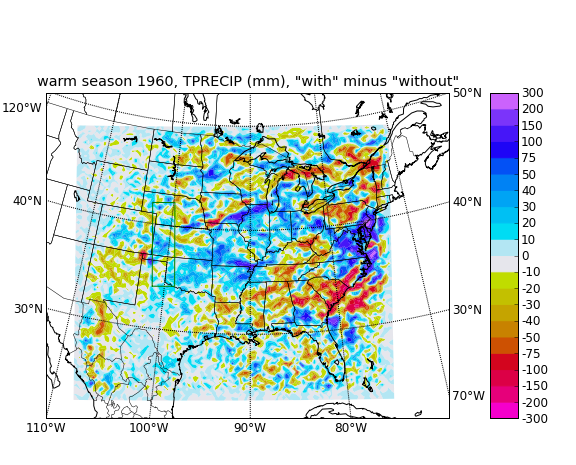
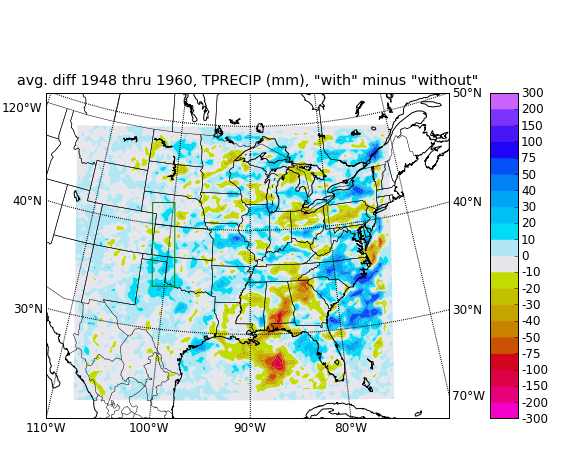
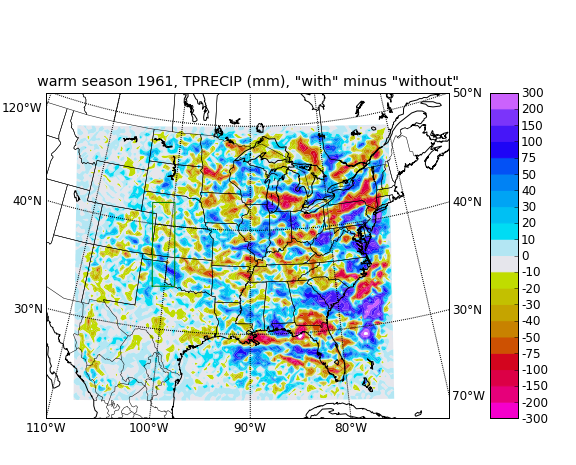
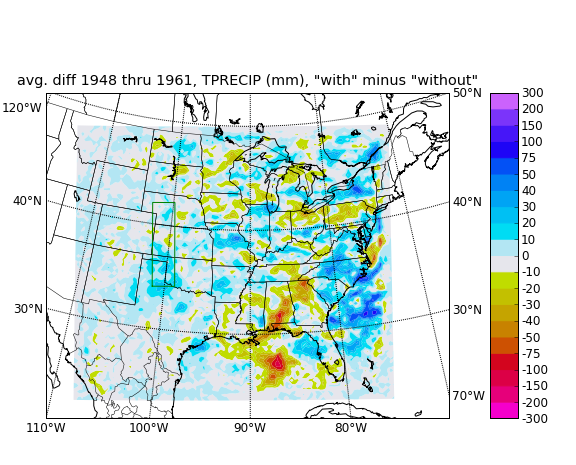
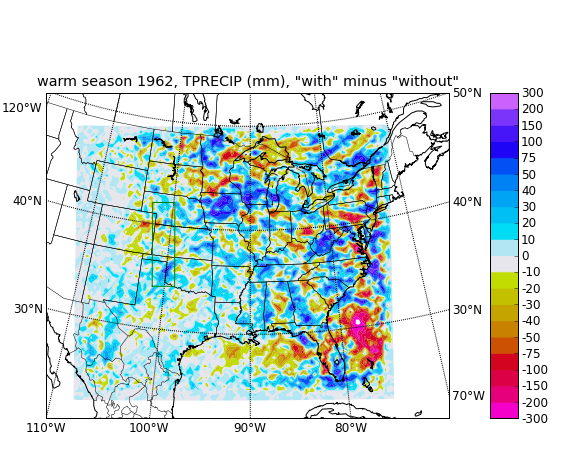
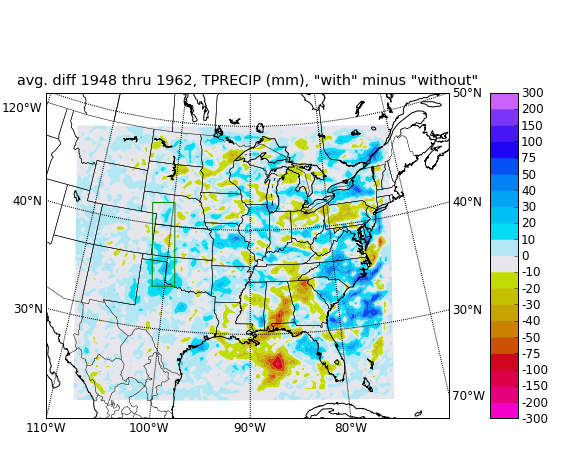
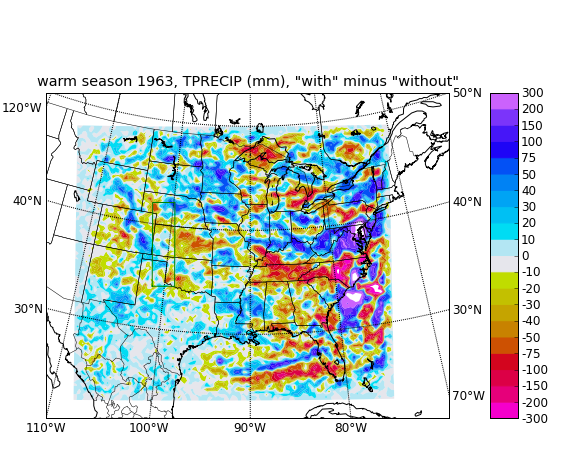

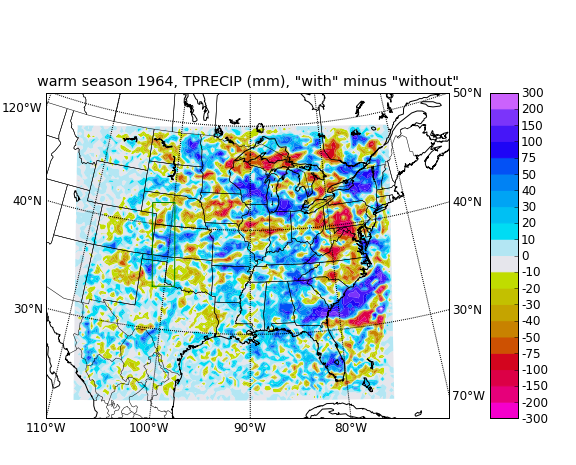
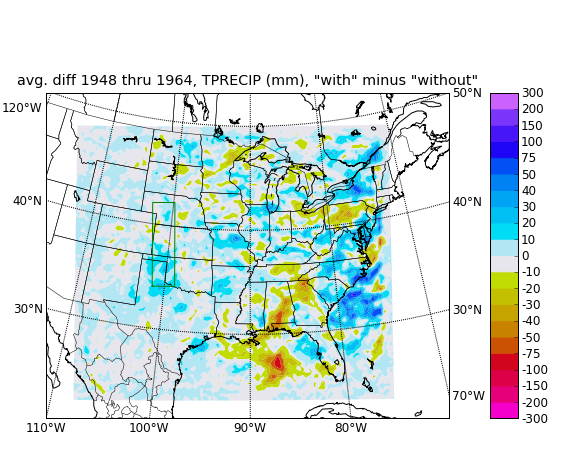

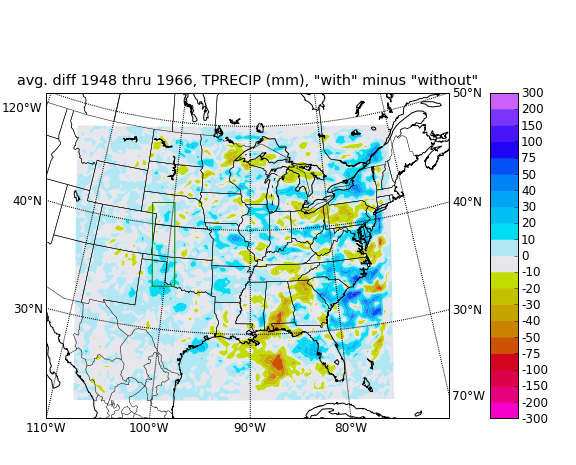
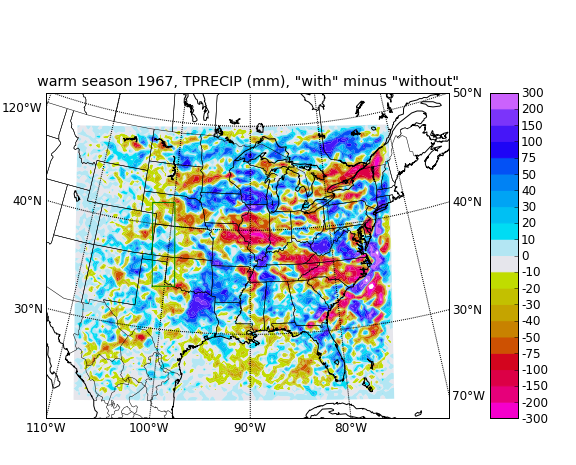
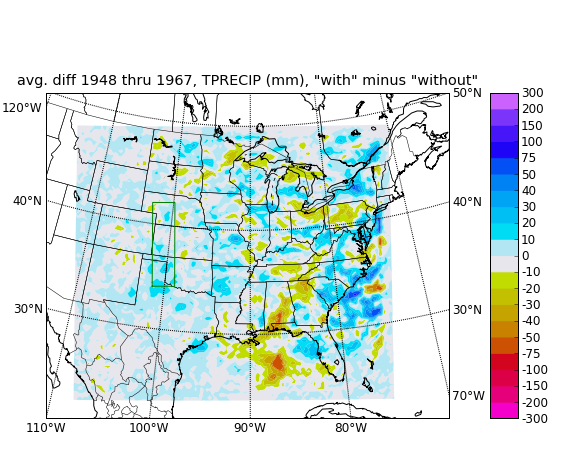
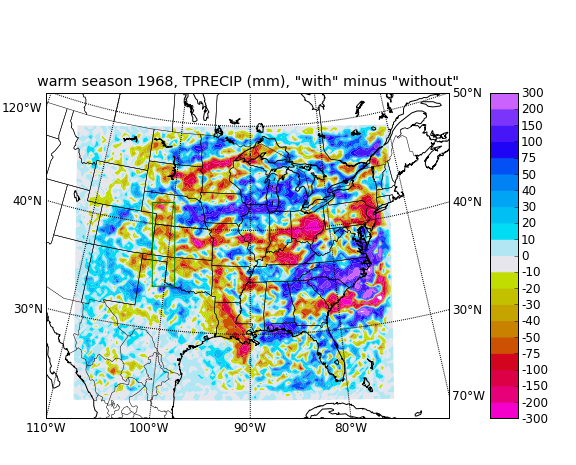
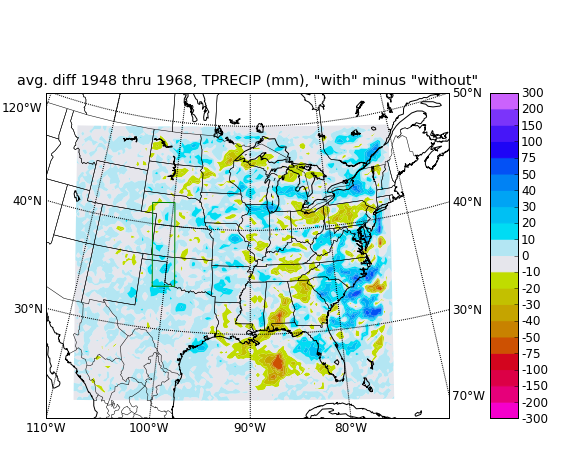
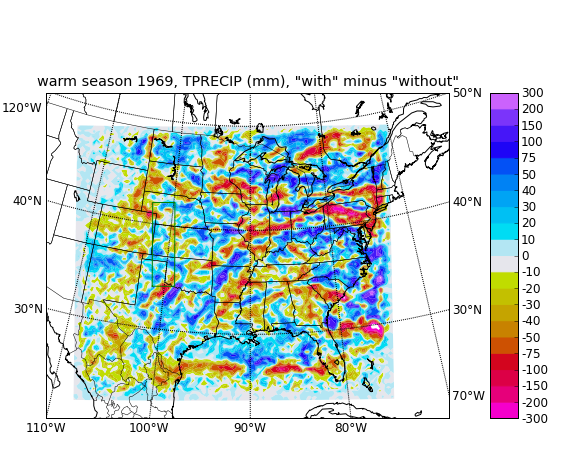
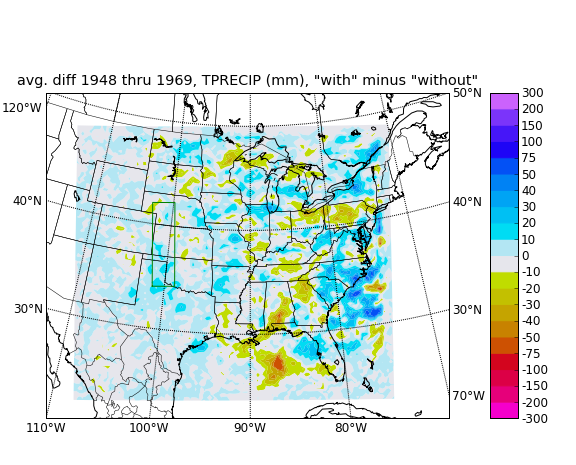
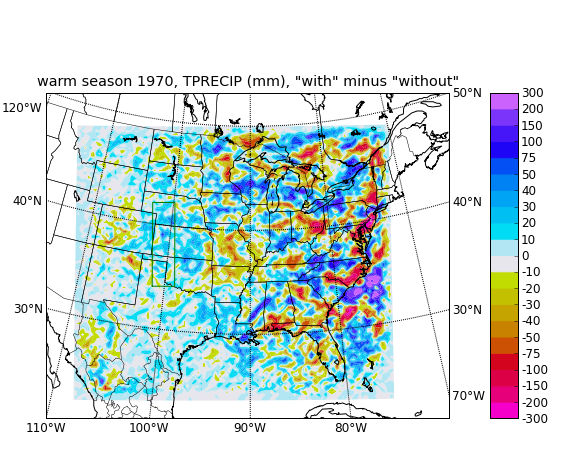
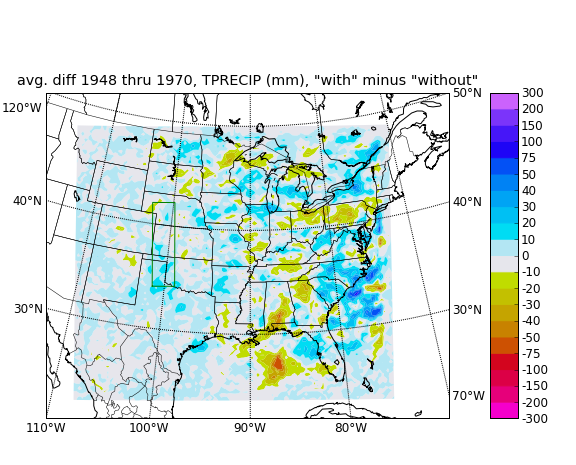
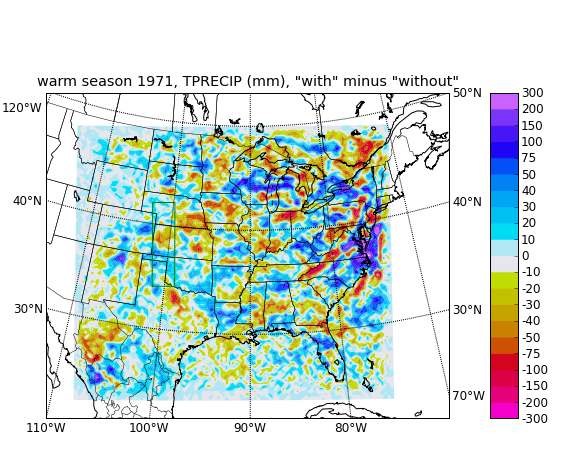
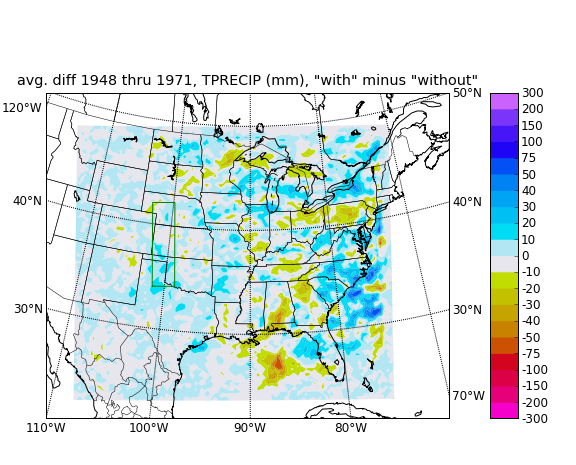
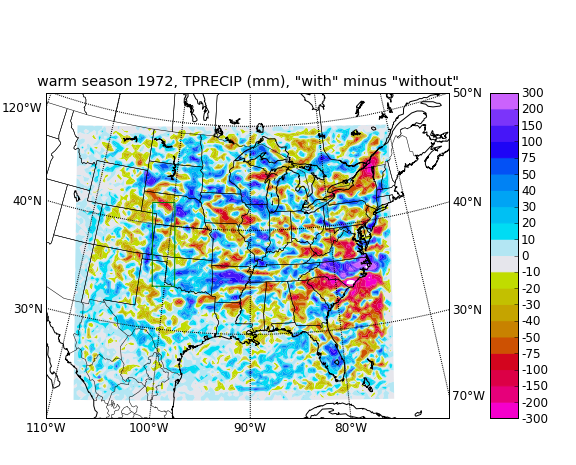
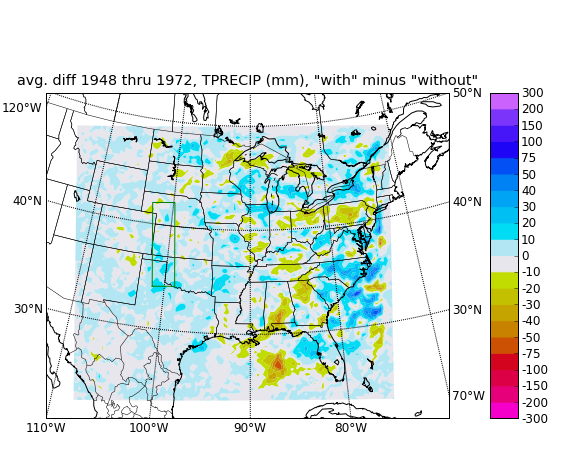
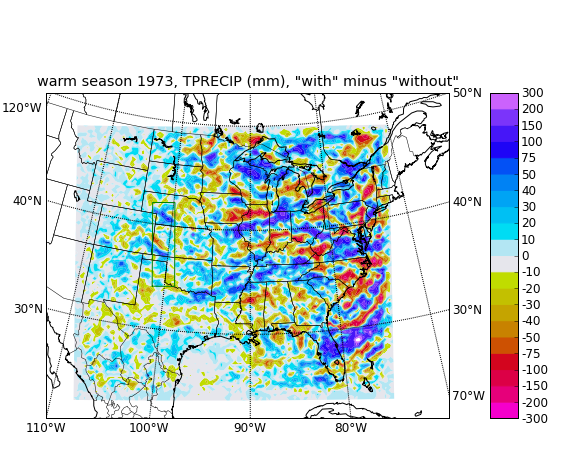
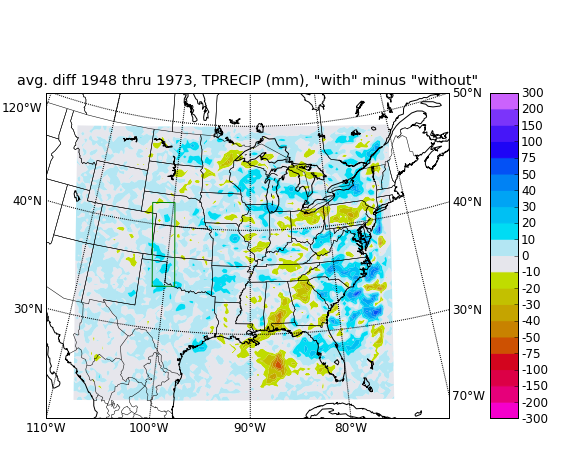
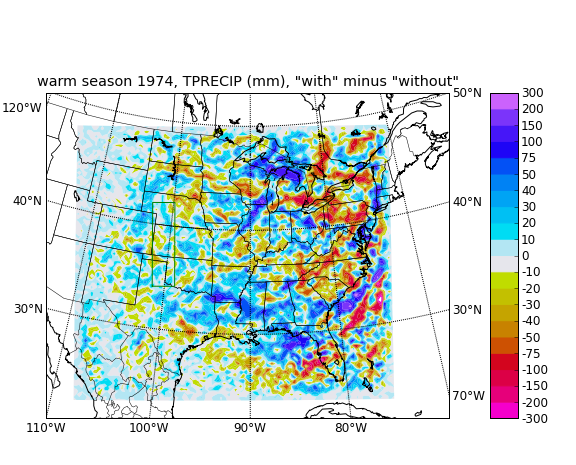
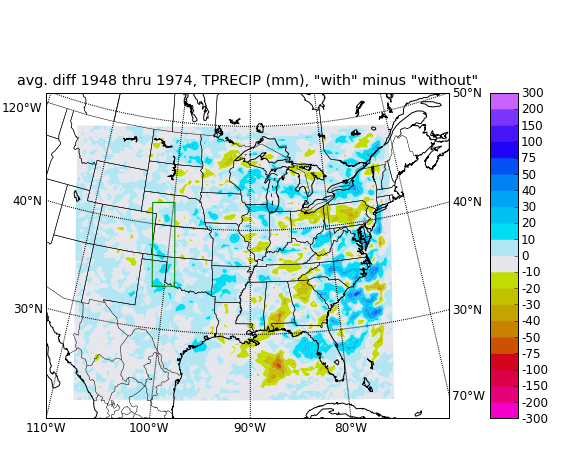
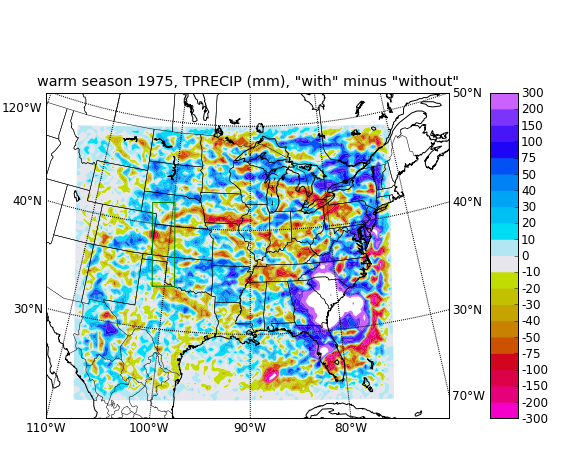

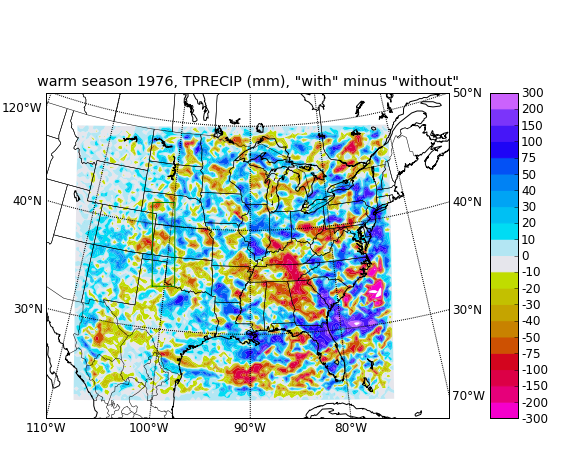

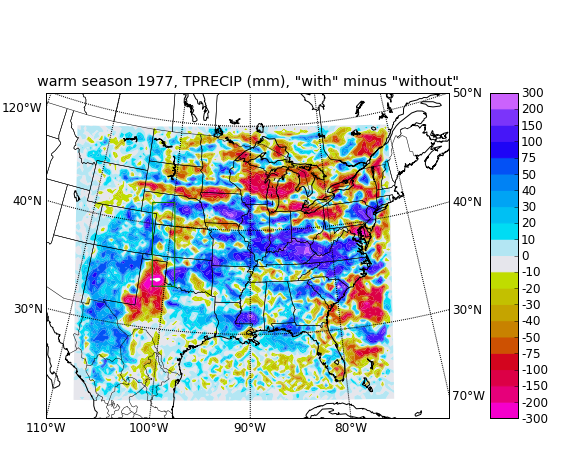

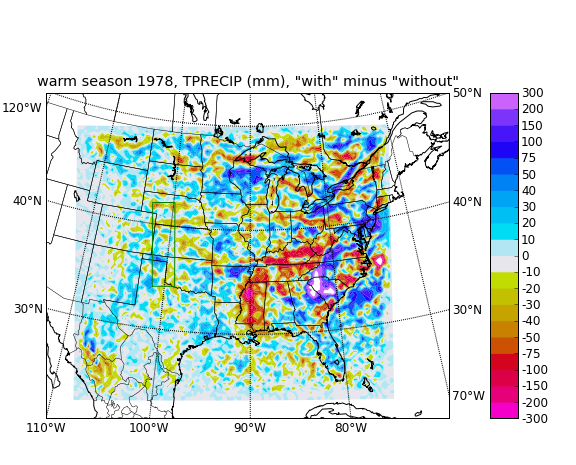

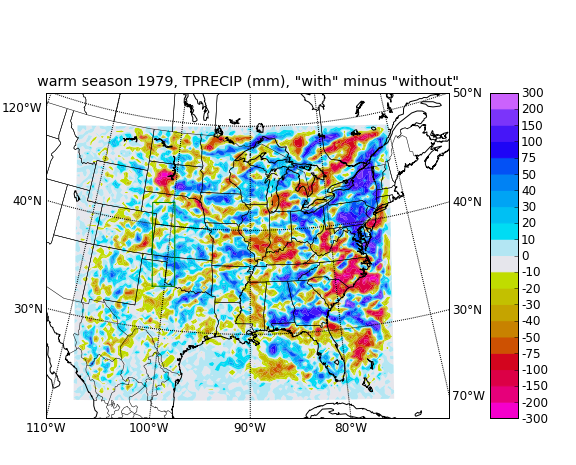

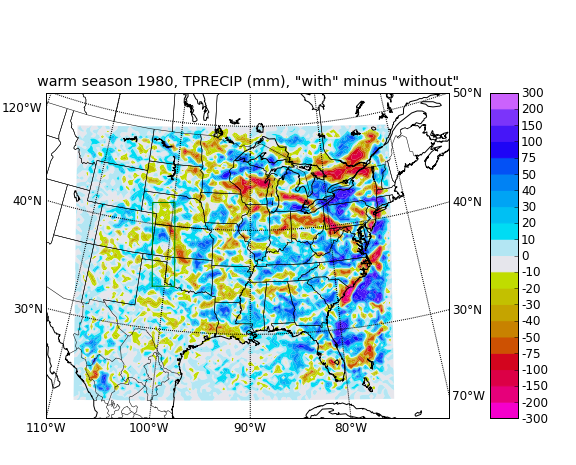
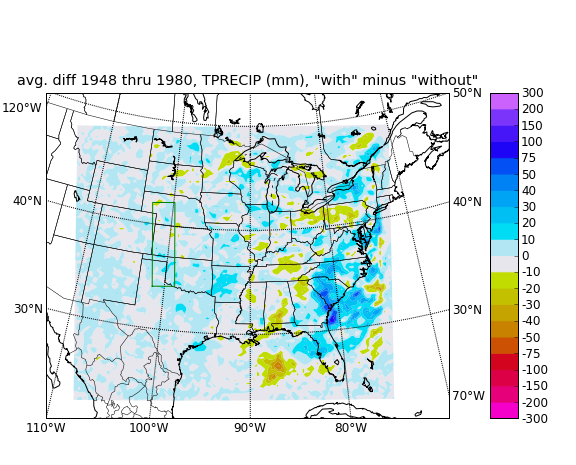
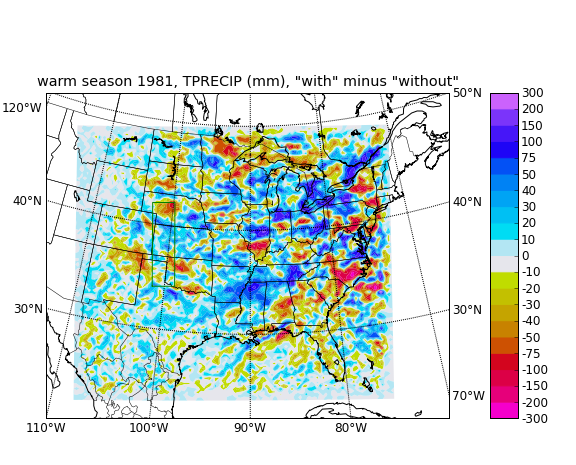

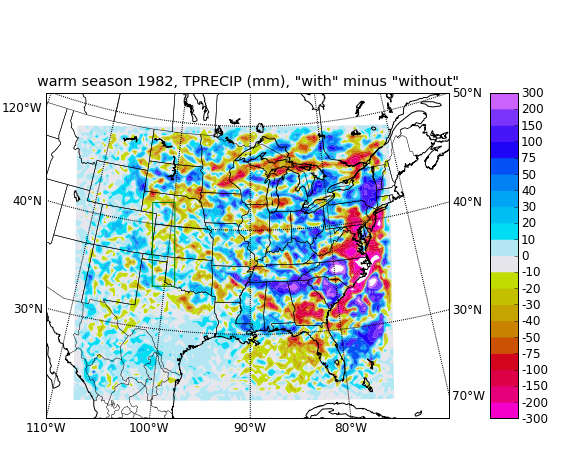
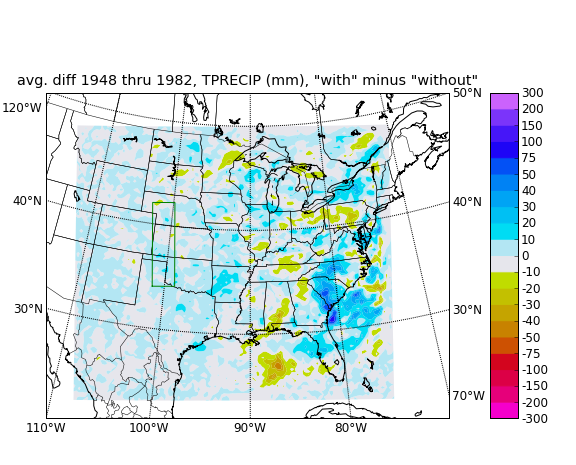
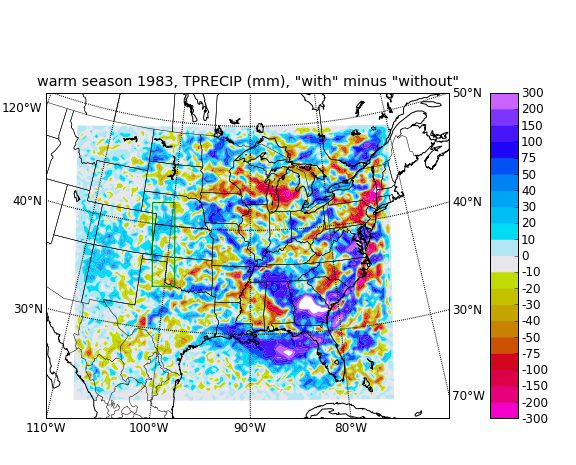

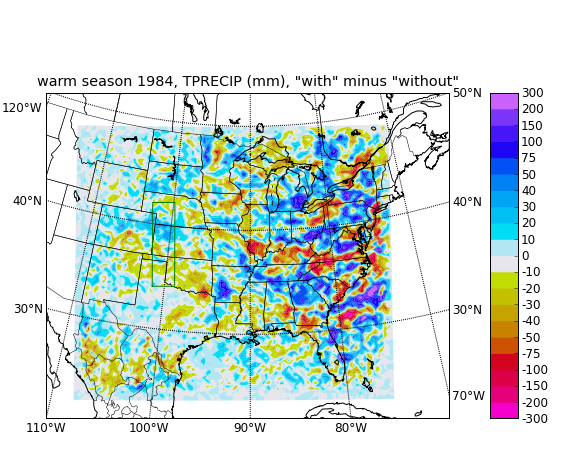
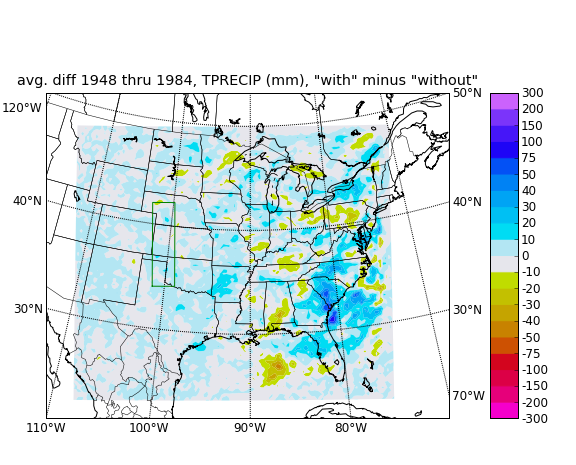
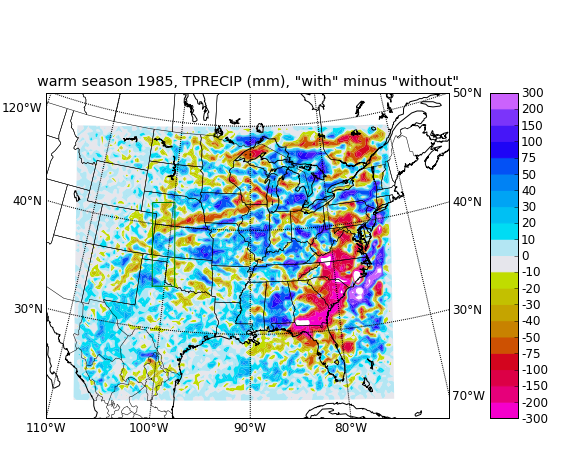

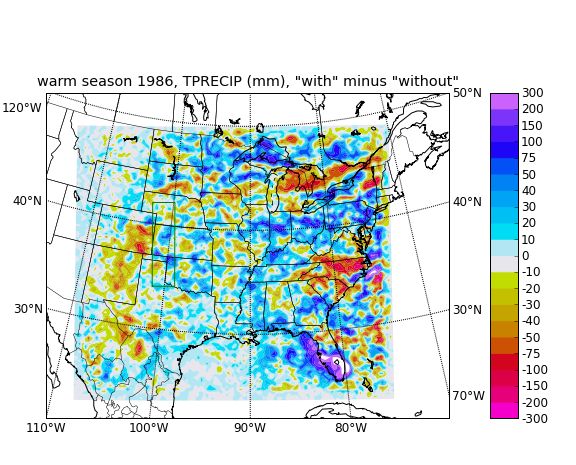

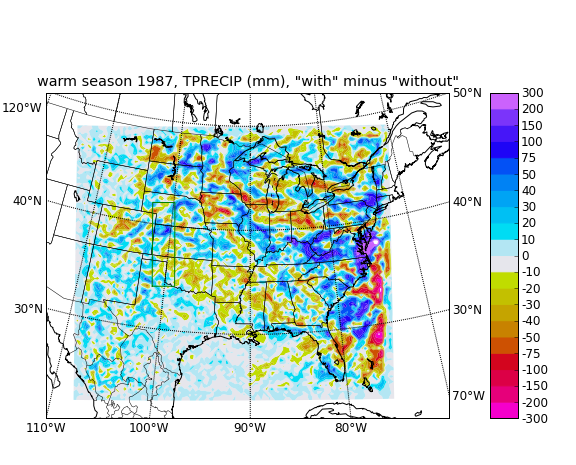

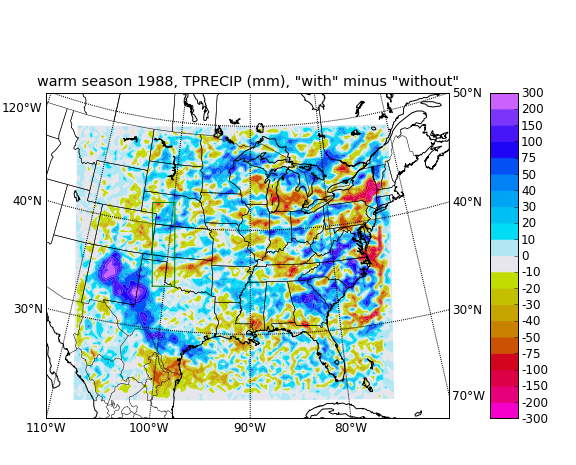
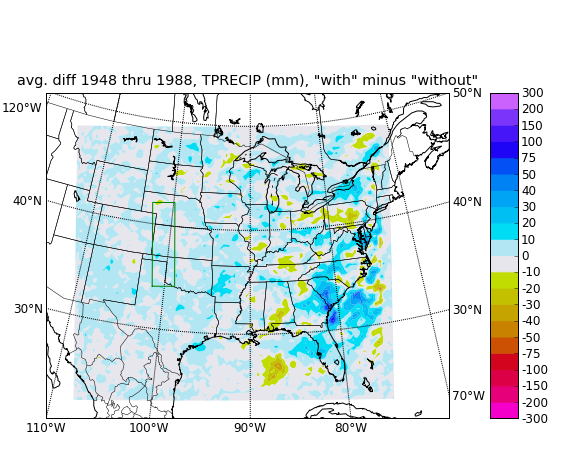
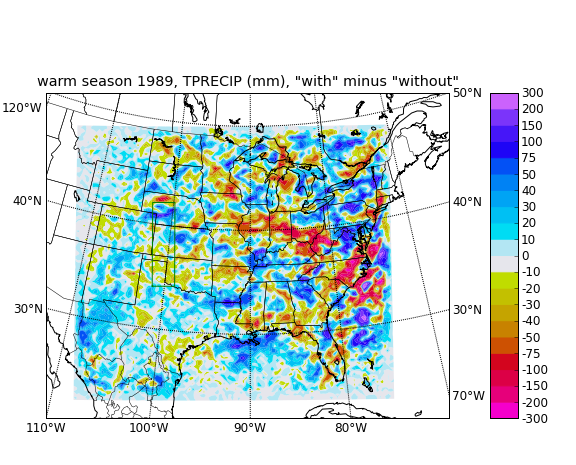

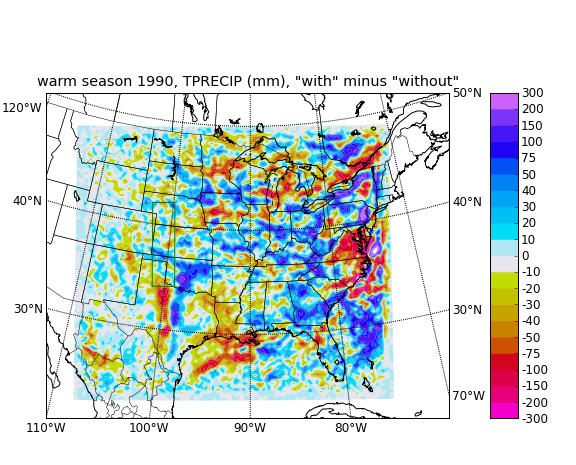

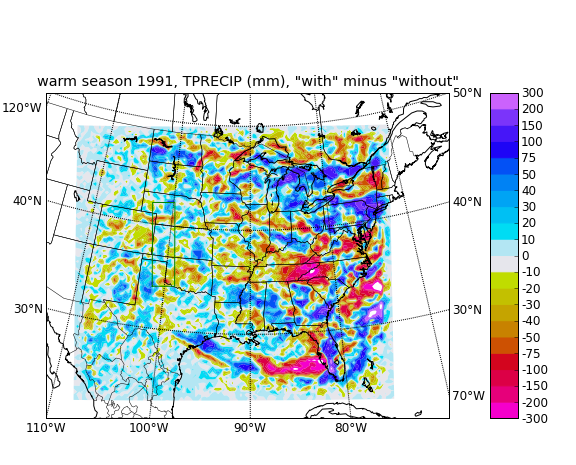

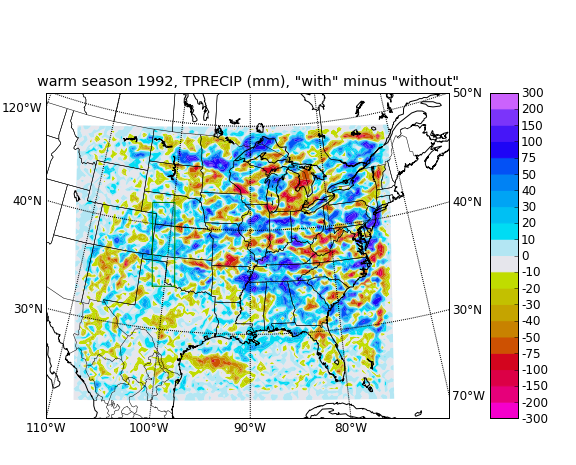

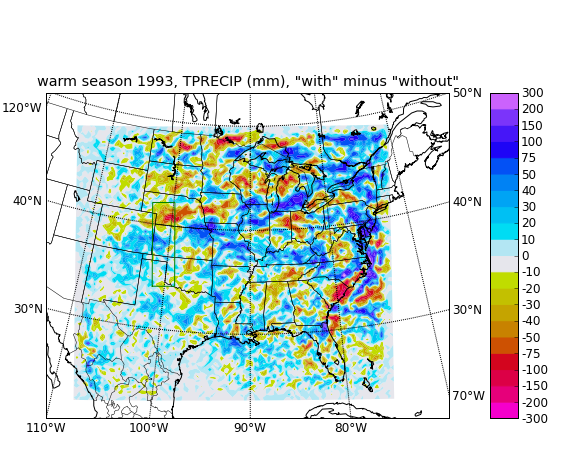

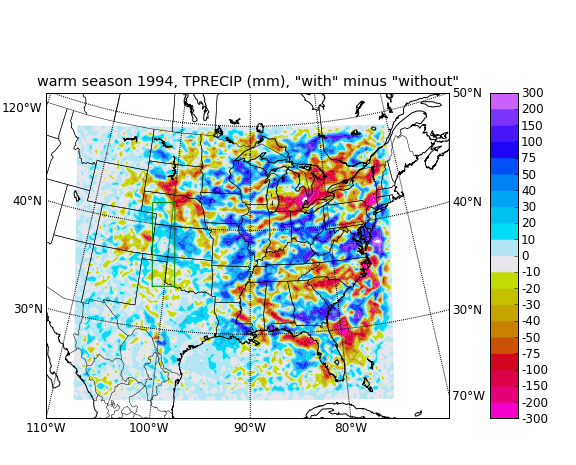

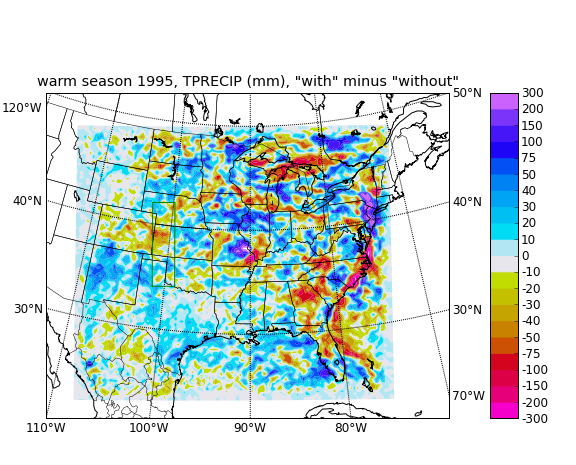

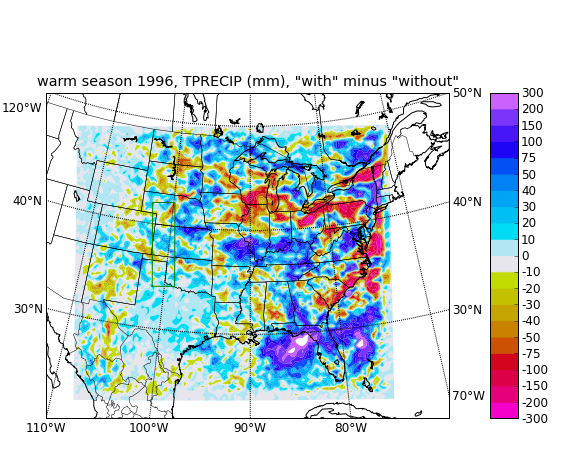

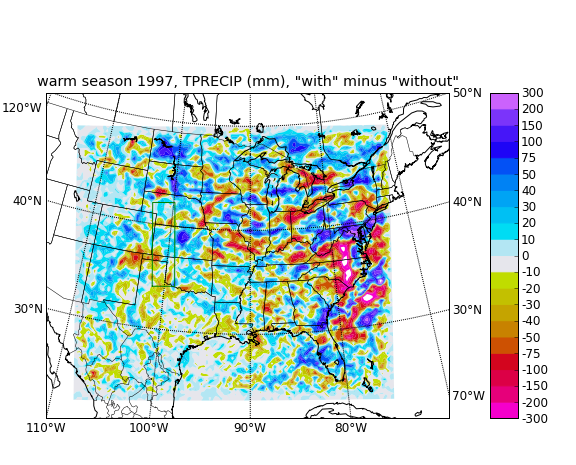

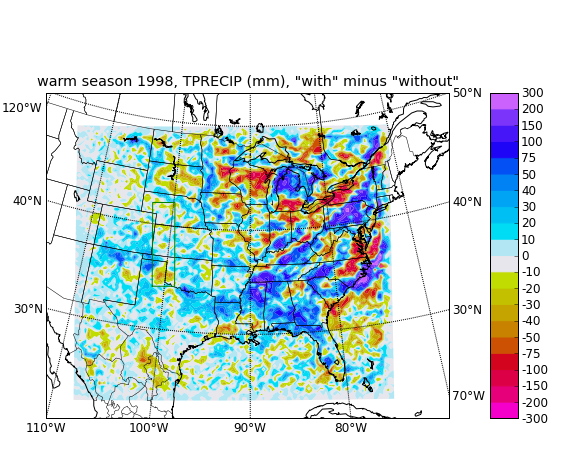

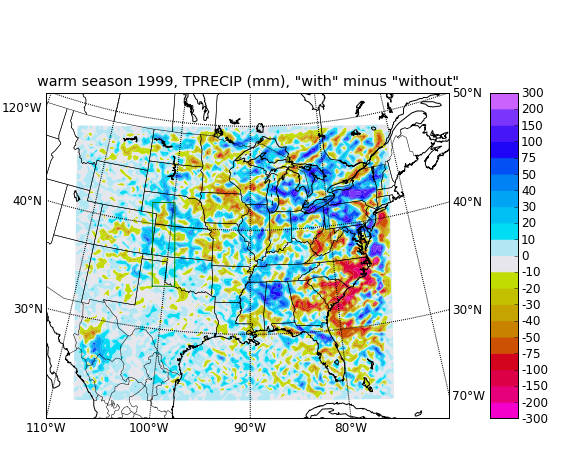

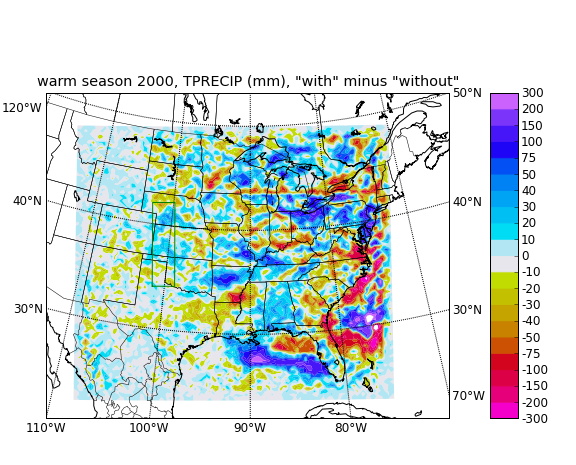
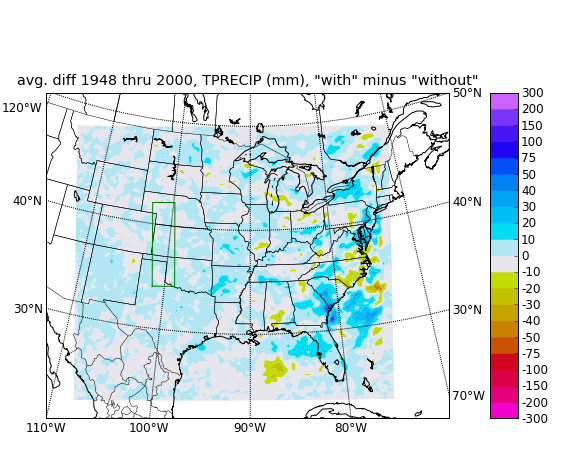
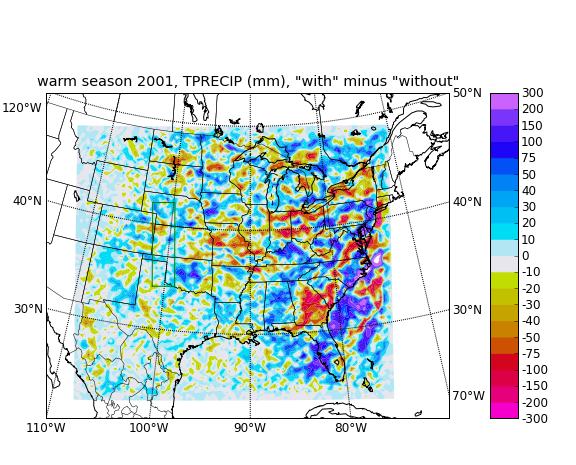
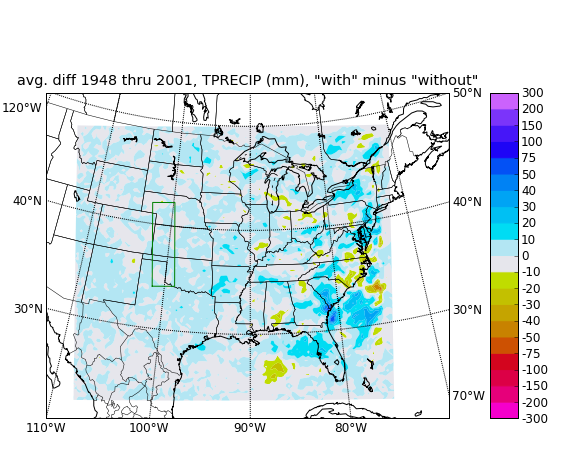
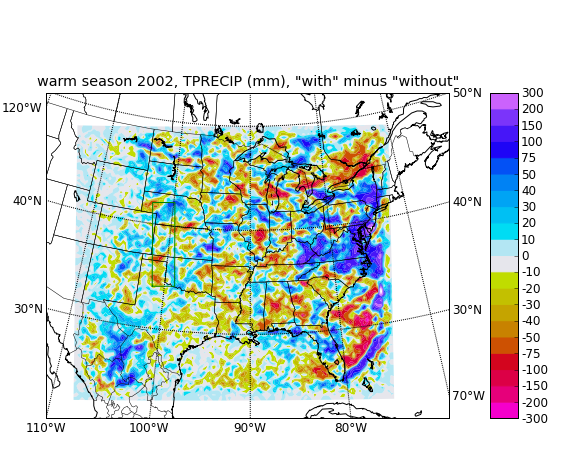

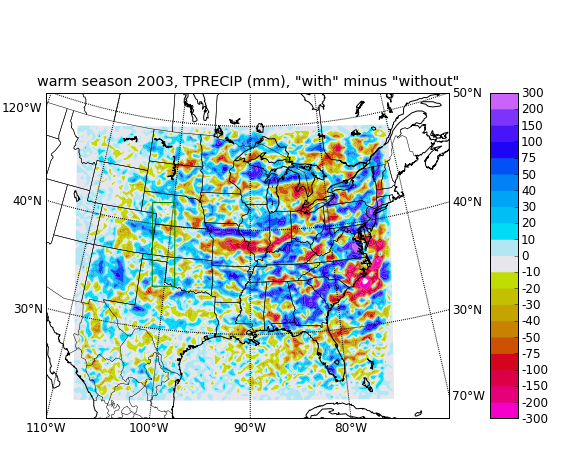

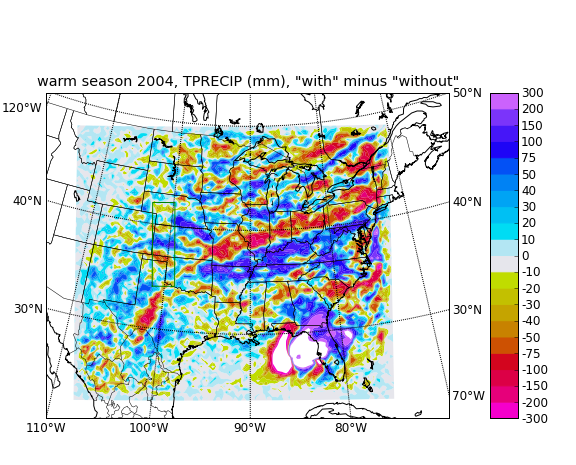

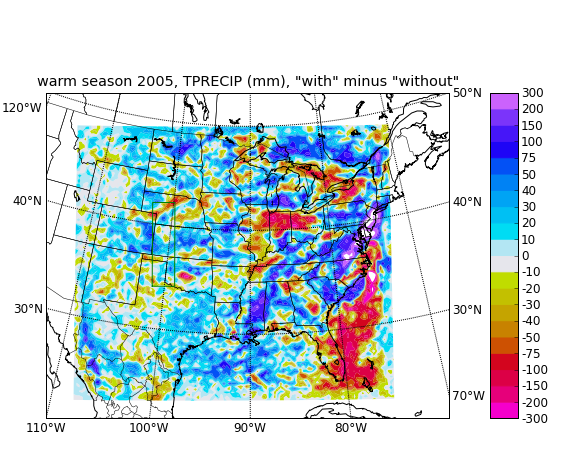

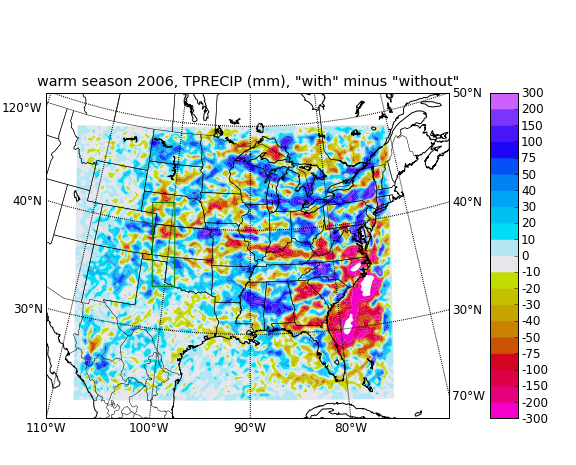

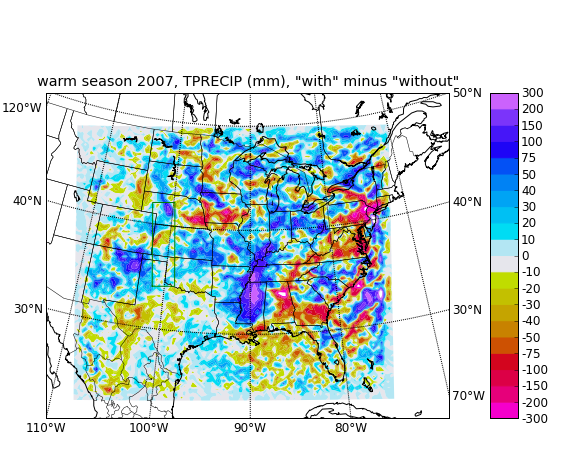

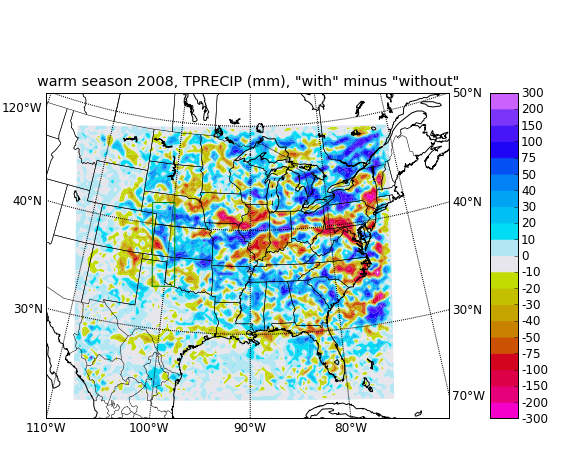

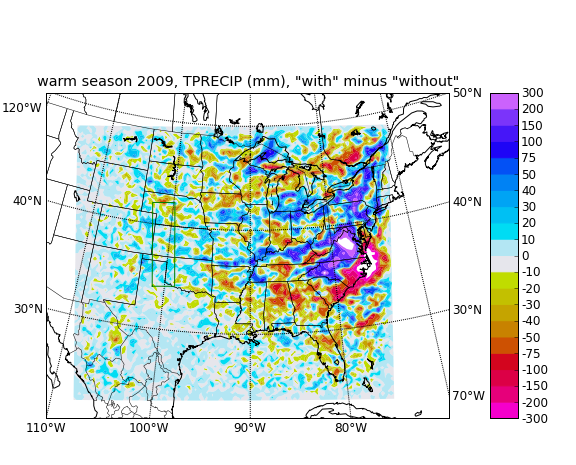
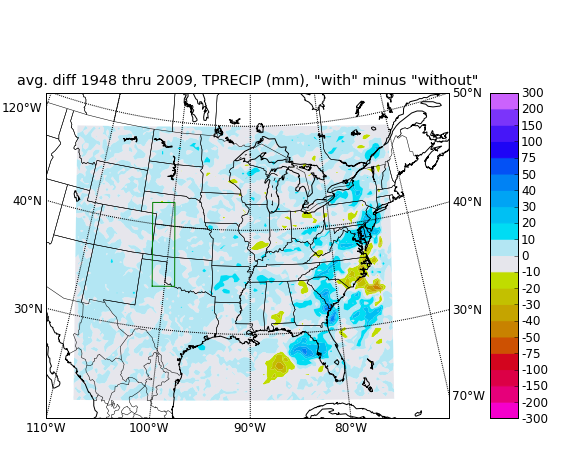
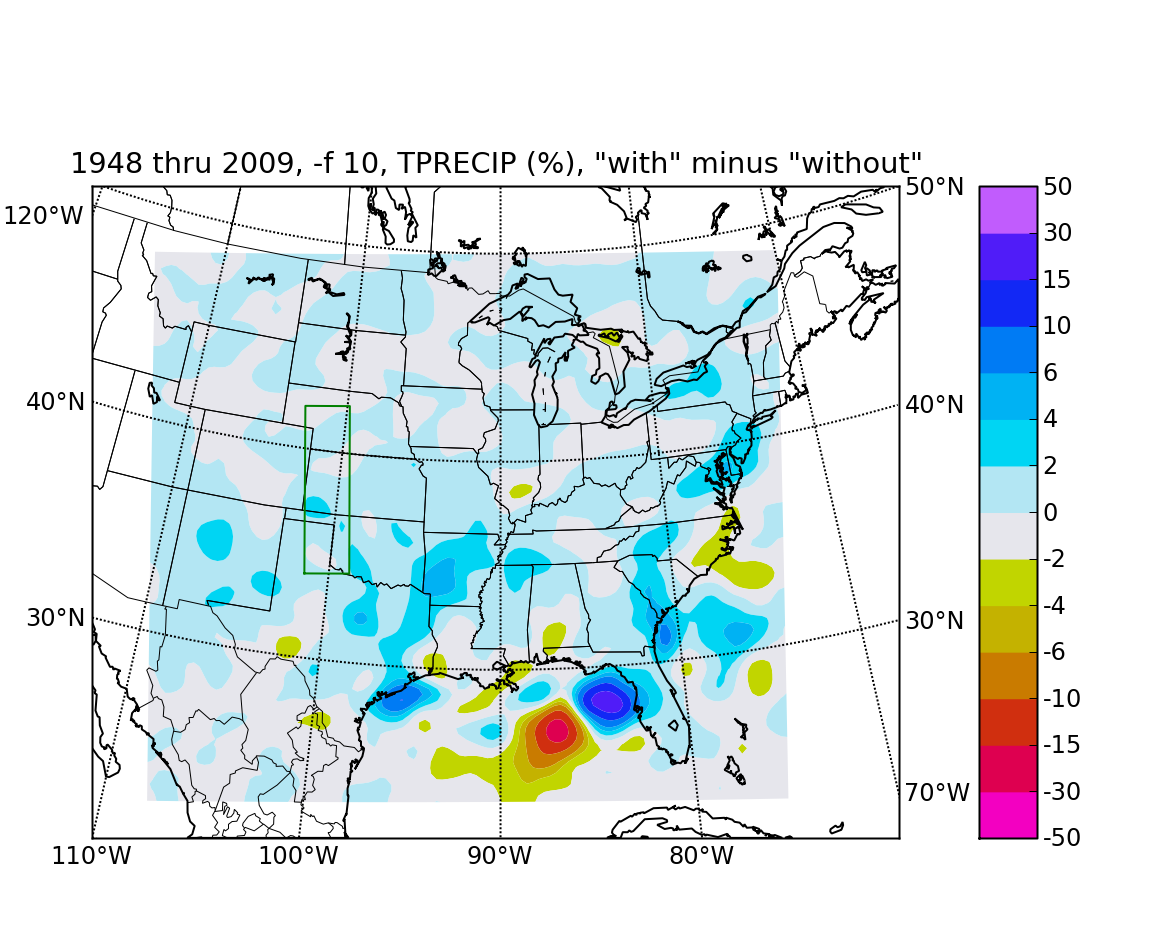
The 20 year saga is now revealed. The big plot below summarizes the 20 year precipitation difference, ("with"-"without")/"without". The plot is based on data that has been slightly smoothed using a Gaussian filter.
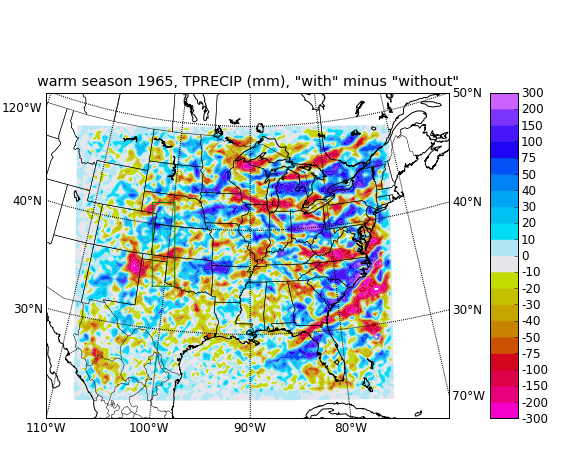
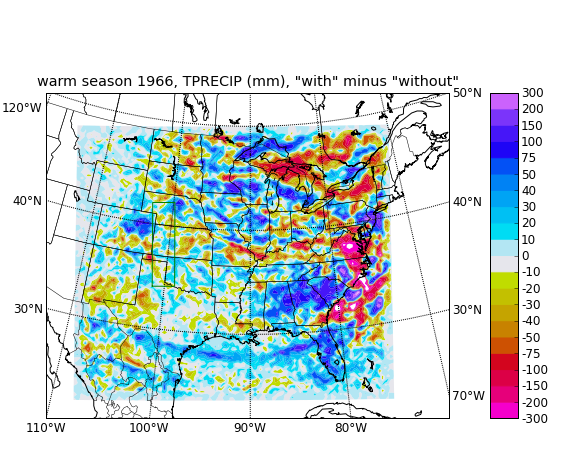
| yearly warm season rainfall: | average of years from 1990: |
|
|
|
|
|
|
|
|
|
|
|
|
|
|
|
|
|
|
|
|
|
|
|
|
|
|
|
|
|
|
|
|
|
|
|
|
|
|
|
|
|
|
|
|
|
|
|
|
|
|
|
|
|
|
|
|
|
|
|
|
|
|
|
|
|
|
|
|
|
|
|
|
|
|
|
|
|
|
|
|
|
|
|
|
|
|
|
|
|
|
|
|
|
|
|
|
|
|
|
|
|
|
|
|
|
|
|
|
|
|
|
|
|
|
|
|
|
|
|
|
|
|
|
|
|
|
|
|
|
|
|
|
|
|
|
|
|
|
|
|
|
|
|
|
|
|
|
|
|
|
|
|
|
|
|
|
|
|
|
|
|
|
|
|
|
|
|
|
|
|
|
|
|
|
|
|
|
|
|
|
|
|
|
|
|
|